The Goals module gives every sales person a clear breakdown of their performance across the entire year. It tracks your monthly activity, compares results against your targets, and shows your current pipeline count.
Goals are displayed in an easy-to-read grid so you can see where you’re winning and where you need to push harder.
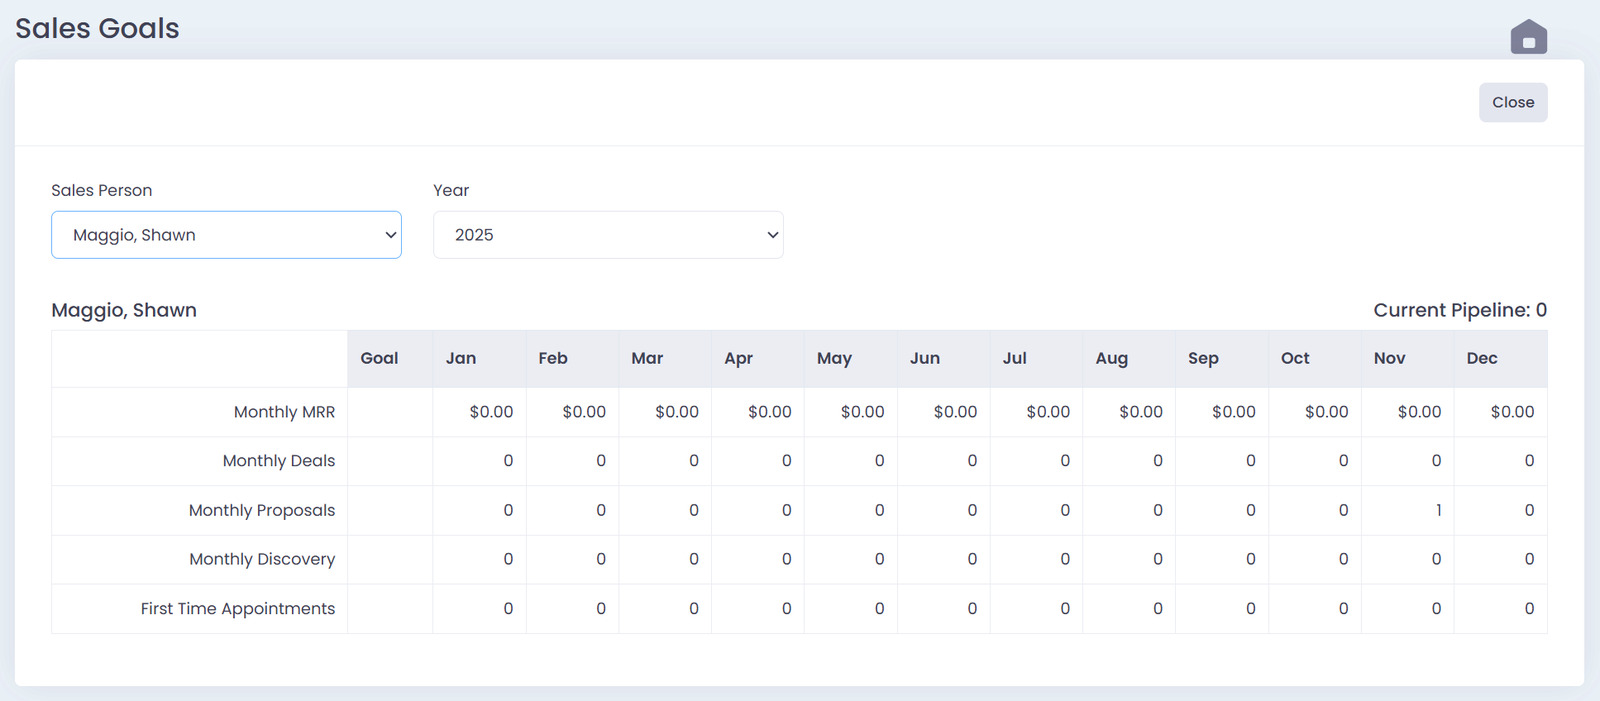
Filters
At the top of the Goals module you can choose:
- Sales Person — View an individual rep or all reps
- Year — Switch between years to see historical or future goals
These filters instantly update the entire goals dashboard.
Reading the Goals Grid
Each sales person has their own section showing:
Goal Row
The target set for each metric.
Monthly Columns
January through December show actual numbers recorded in QwikSell throughout the year.
Metrics Tracked
The Goals module tracks:
- Monthly MRR
- Monthly Deals
- Monthly Proposals
- Monthly Discovery Calls
- First Time Appointments
These metrics update automatically based on your quoting and prospecting activity.
Color Coding
The grid uses simple visual cues to help you identify performance quickly:
- Red/Pink shading indicates the rep is under goal for that month.
- White or unshaded indicates goal requirements were met or exceeded.
This lets reps know where to focus without needing to analyze reports.
Current Pipeline Count
To the right of each sales person’s section, you’ll see:
Current Pipeline: X
This number shows how many active opportunities each rep currently has in the pipeline.
It’s updated automatically from the My Pipeline module.
How the Goals Module Helps Your Team
With Goals, your team can:
- Track their performance throughout the year
- Quickly identify months where activity was high or low
- See which areas need more attention (calls, proposals, deals, etc.)
- Monitor pipeline health
- Stay accountable to their quotas
Everything is automatic. No spreadsheets. No manual tracking.